


INTRODUCTION
Not long after the World Health Organization declared COVID-19 to be a worldwide pandemic on March 11, 2020, many U.S. state and local governments, including those in the West Coast regions that account for most wineries and much of the wine tourism in the U.S., began issuing orders that severely curtailed a winery’s ability to operate its tasting room as it had before the pandemic. Before the end of March, California, Oregon, and Washington all had orders in place that effectively shut down winery tasting rooms, and the orders stayed in place in most locations until mid-May or later.
Wine tasting rooms in the United States play an important role in the wine industry and the economic vitality of the regions that wine tourists visit. The Wine Institute estimated that in 2015 California’s wine regions had over 23.6 million visitors who added $7.2 billion to the economy (Wine Institute, 2015), and much of the wine tourism is centered on visiting wineries and winery tasting rooms. Wine tourists are generally well-educated and affluent, and they eagerly buy wine when they experience “pleasure” with their wine tourism experience (Bruwer & Rueger-Muck, 2019).
As of 2021, the U.S. had more than 11,000 bonded wineries, and over 80% of them produced fewer than 5,000 cases annually (Sovos ShipCompliant and Wines Vines Analytics, 2022, p. 3). Smaller wineries are highly reliant on direct-to-consumer (DTC) sales, especially through tasting room sales, for their success (Haverila et al., 2021; Shapiro & Gómez, 2014). In 2021, wineries reported that the tasting room accounted for a higher percentage of sales, 29%, than any other channel (Silicon Valley Bank, 2022, p. 21). To the extent that customers who buy wine from the winery through wine clubs, mailing lists or subscriptions, and online or phone orders first became customers through past tasting room visits, tasting rooms influence almost 2/3 of sales.
When wineries were allowed to offer in-person wine tastings again after being closed for months due to COVID, they faced numerous restrictions that had not been in effect prior to the pandemic, such as being allowed to serve customers only outdoors, creating proper social distancing between parties, limiting party size, requiring reservations, and restricting capacity to as little as 25 percent of what had been allowed. Hosting wine club events such as pick-up parties was suddenly not a viable option. Moreover, restrictions on travel and lodging and concerns about the risks of contracting COVID-19 kept potential visitors away, compounding the pandemic’s negative impact on direct-to-consumer wine sales. Wineries quickly realized that they needed to find new ways to engage with, and sell wine to, their customers.
One way some wineries did this was to move wine tastings online, as numerous people had done with school, business meetings, and get-togethers with family and friends. Prior to the advent of the pandemic, virtual wine tastings were relatively unknown. The pandemic created a need, and offered a unique opportunity, to present virtual wine tastings. We observed the number of virtual wine tastings available increase dramatically during the pandemic’s first few months. For most wineries, virtual wine tastings were implemented quickly on a trial-and-error basis.
Virtual wine tastings took a variety of forms and came in different formats. Perhaps the only two features all virtual wine tastings had in common were that they featured wine and were delivered (or webcast) over the internet. Moreover, in virtual form wine tastings were no longer limited to wineries or businesses like wine bars. Stores, other businesses, and organizations could sponsor and host virtual wine tastings.
Many wineries turned to the seemingly ubiquitous Zoom platform to deliver virtual wine tastings. Zoom offered wineries the opportunity to require participants to register for the event, allowing wineries to collect contact information and other potentially useful data such as geographic location or participation by wine club members or other customers already in their system. Others used platforms such as Facebook Live or Instagram Live that allowed for better integration with their social media accounts but resulted in people participating anonymously. A few businesses, such as wine.com, invested in the development of a proprietary system for its virtual tastings. Wineries did not charge to participate in the virtual tasting, but some wineries required a wine purchase in order to gain access to the webcast.
Virtual wine tastings were distinctly different from the in-person events for which they tried to substitute. To start, participants did not have hosts pour wine for them, answer questions, or leave them alone to enjoy and contemplate the wine. In fact, most elements of service that tasting room visitors normally encounter were not present (e.g., facilities were neat and clean; employees provided service in a timely manner) or took a substantially different form in virtual wine tastings (e.g., the lighting is appropriate; the employees were knowledgeable and skillful).
Hosts did not even have to have the ability to provide the wines featured in the tasting to participants, and the duration of a virtual tasting was filled with something to see and hear. Importantly, a single virtual wine tasting experience was presented to all guests, and the host could not make individual adjustments for each party participating in the tasting. Virtual wine tastings were more like a broadcast than a traditional hospitality experience.
Our discussions with wineries indicated that they expected it would take more than an online version of a standard wine tasting to keep consumers engaged and attentive during the hour typically scheduled for the event. They also felt a sense of experimentation in discovering what kind of virtual wine tasting would most appeal to their target market and would engender repeat virtual visitors and determining how participants would perceive service quality in the interaction.
Most virtual tastings were webcast live. We saw very few virtual tastings where the only option was to view a recording. Some hosts recorded the live webcasts and made them available on platforms such as YouTube or Vimeo or posted the video to their website. Some hosts invested in cameras, lighting, and sound equipment while others used a basic webcam and regular lamps and room lights. Some hosts developed elaborate sets while many used the winery’s tasting room or barrel room, an outdoor patio, or even the winemaker’s living room for the location. Some virtual tastings encouraged audience participation while others were essentially view-only events.
Schramsberg Vineyards in Calistoga featured various special guests, including a charity fundraiser with the owner of the San Francisco 49ers along with celebrity winemaker Celia Welch. Alpha Omega Winery in St Helena offered chef recipes and food pairing tips, and one of their early virtual wine tastings featured a luau theme with a stage, sets, design, chefs, and entertainers on the scenic winery property. Blue Ostrich Winery in North Texas shipped a snack pairing along with sample-size wine bottles, and the co-owner winemaker acted as DJ and played music during many of the virtual events (Conover, 2020). A sense of the vast array of virtual wine tasting approaches may be found in ezine articles and blog posts from Conover (2020), Freedman (2021), and Denig (2022).
Wineries, along with wine stores and non-winery wine clubs, discovered a new sales channel, mode of advertising, and source of orders from both existing and new customers. According to wine.com Brand Manager Addie Wallace, “out of the box, they [virtual tastings] were a huge hit” (Conover, 2022, pp. 2, 17). While some wineries were quick to drop virtual wine tastings when visitors could return to the tasting room, others have continued to offer virtual wine tastings as an additional way to engage with their customers and as a new sales channel.
This paper is an exploratory study of the features of a virtual wine tasting that participants in the U.S. find most engaging. Tasting room visitors and wine tourists more generally have been the subject of numerous academic studies from different perspectives. We adopted the concept of winery tourism as a hedonic experience as the framework for our study of virtual wine tastings and apply the experiential view first applied to wine tourism by Bruwer and Alant (2009). As the first paper, to our knowledge, to focus on virtual wine tasting participants, we begin to extend the understanding of wine tourism as a hedonic experience applying the experiential view to an online setting to understand which hedonic motivations carryover to the virtual format and remain important for participants in online wine tourism in the form of virtual wine tastings.
LITERATURE REVIEW
Wineries may use the tasting room experience to cultivate relationships with customers that build commitment and loyalty (Nowak & Newton, 2006), connect with a new generation of wine drinkers to develop long-term, profitable relationships based on continued patronage (Nowak et al., 2006), and establish brand loyalty (Bruwer et al., 2013; Fountain et al., 2008). To accomplish any of these goals, wineries need to understand what the visitor is looking for in the tasting room experience.
Pan et al. (2008) found that a pleasant atmosphere created by exterior and interior features, design, appropriate information displays, and the appearance and demeanor of the staff and other customers strengthens the customer’s affective commitment and leads to strengthening the customer’s repetitive purchasing intention. McDonnell and Hall (2008) demonstrated the utility of a servicescape framework to winery cellar doors and developed a diagnostic tool for wineries to evaluate their servicescape attributes. Neither study, however, explicitly applied the experiential view of wine tourism or considered its hedonic nature.
Bruwer and Alant (2009) first applied the experiential view of consumption in the context of wine tourism to explore the nature of the motivations of wine tourists and determined that the motivations guiding the visitors’ behavior are predominantly hedonic in nature. Incorporating wine region brand perceptions, Bruwer and Lesschaeve (2012) recognized the importance of the destination region brand image, and the natural beauty of wine region in particular, to the enjoyment of the wine tourism experience. They extended the concept of the servicescape to develop a model of the winescape that included natural and social environments of wineries. Their results added credence to the view that wine tourists seek hedonic experiences, especially among first-time visitors to the region.
Leri and Theodoridis (2019) studied the relationship between winery servicescape and winescape attributes and the visitor’s hedonic experience. They found that visitor’s evaluation of the winery environment, other visitors’ appropriate behavior, and the visitor’s desire to learn something new and to have fun during the winery experience lead to the emotions that positively impact a visitor’s overall satisfaction, which in turn positively influences the visitor’s post-experience intentions to revisit the winery and give it positive word-of-mouth.
Bruwer and Rueger-Muck (2019) further expanded the understanding of the motivation-based experiential view of wine tourism and reinforced the awareness that motivations guiding visitors’ behavior are predominantly hedonic in nature. They also found that the importance of some specific motivation factors for visiting a specific winery varied across generational cohorts. However, the age generation of tourists did not change the way they perceived a wine region’s characteristics.
Based on the premise that wine tourists seek a holistic and hedonic wine experience, Santos et al. (2020) developed and validated an expanded scale to measure the wine experience within a winery tourism experience. Going beyond the winescape, the scale measured dimensions of wine storytelling, wine tasting excitement, and wine involvement. In their tests of the scale, they found that wine storytelling had the strongest relevance and impact. Quintal et al. (2022) applied push-pull theory to examine the hedonic winescape traits of wine tourism and generated a segmentation basis for analyzing Australia’s wine tourism market. They determined that four winescape pull attributes (winescape setting, wine quality, value, and staff) and two experience push attributes (experience and bonding) best allowed for segmentation and resulted in four categories of wine tourists (Inspired, Self-driven, Market-driven, and Inert).
Prior research firmly establishes the concept of hedonic experience as a useful lens through which to study wine tourists and hedonic motivations as determinants of the decision to visit a specific winery, tour a particular wine region, or participate in wine tourism in general. Accordingly, we adopted the concept of winery tourism as a hedonic experience as the framework for our study. Some of the physical attributes of the winescape such as the landscape having a rural appeal or attractive scenery or the winery buildings having historic or architectural appeal (Bruwer & Gross, 2017; Quintal et al., 2022; Santos et al., 2020) will clearly not apply in the virtual wine tasting setting. Since a virtual wine tasting is not a traditional hospitality experience like an in-person wine tasting at the winery, the extent to which servicescape elements are meaningful in an online environment is unclear. Nonetheless, research on the importance of hedonic motivations, including micro-winescape and servicescape elements, provides a valuable framework for investigating the features of a virtual wine tasting that participants in the U.S. find most engaging when deciding which virtual wine tasting, if any, to experience.
FEATURES OF A VIRTUAL WINE TASTING
We participated in 15 virtual wine tastings in different formats and read advertisements and website descriptions of 40 – 50 more virtual wine tastings in the U.S. Based on our observations and the attributes wineries and others featured in their ads and descriptions, we then created an ad hoc list of features that characterized the virtual wine tastings and could provide a hedonic motivation for someone to participate in the tasting. Importantly, we did not observe wineries highlighting attributes of the regional winescape as described by Bruwer and Alant (2009), Bruwer and Lesschaeve (2012), and others. Accordingly, we focused our list of features on the micro-level experience.
The initial list contained more than 30 items. We next grouped specific features into 12 feature categories, listed and briefly described in Table 1. For example, we grouped features such as live music, DJ, trivia, games, and non-wine themes (e.g., a luau) as Entertainment. The explanation for each feature as given to survey participants may be found in the Appendix.
While some hedonic motivation factors such as “rural setting,” “have a day out,” or “have a barbeque or picnic,” identified in Bruwer and Alant (2009), Bruwer and Lesschaeve (2012), and Bruwer and Rueger-Muck (2019)[1] do not have a similar feature in a virtual wine tasting, most of the features we identified in virtual wine tastings are strongly related to hedonic motivations for visiting a winery tasting room, factors of the winescape, or elements comprising the servicescape of tasting rooms that have been recognized in previous research, as noted in Table 1.
Someone whose winery tasting room visit is highly motivated by the opportunity to “meet the winemaker” may well think that Presenter is an important consideration in deciding on which virtual tasting to join. Likewise, someone who is highly motivated to “learn more about wine” or “find information” may be likely to think that Education is an important feature. Recorded may be important to participants who are interested in aspects related to Education and would like the ability to return to a virtual wine tasting to review the information.
Other hedonic motivation items are open to a wider range of interpretations or manifestations that may or may not be met by features of virtual wine tastings. For example, whether a virtual wine tasting could meet one’s need to “entertain myself and/or others” or “socialize with others” might be influenced by Entertainment, Food Pairing, or Format, depending on how one likes to entertain and socialize. These participants may also be the least interested in Recorded. The Entertainment feature of a virtual wine tasting may also be important to someone who values leisure-related activities as part of the winery servicescape as used in Napolitano et al. (2019).
The quality of the online presentation (Online Quality) may be analogous to the servicescape dimensions of the aesthetics or multi-sensory stimuli of the winery found in Napolitano et al. (2019) or the presentation of the physical environment of the winery found in McDonnell and Hall (2008). Tasting-size Bottles may be related to the hedonic motivation of “taste wine” for participants whose pleasure derives from experiencing multiple different wines or someone who feels “wine tastings are a particularly pleasurable experience” as one of the factors comprising the Wine Involvement dimension of the wine experience scale developed by Santos et al. (2020) but would like not to have to commit to a full-size bottle. The availability of tasting-size bottles could also be important to someone who prioritizes the “wines within my budget” winescape value identified in Quintal et al. (2022). Discount could also be important to someone who prioritizes the “wines within my budget” or “value for money” recognized in Bruwer and Gross (2017) and Quintal et al. (2022).
We investigated whether supporting a winery in the participant’s own region or state was important (Local). Gastaldello et al. (2022) hypothesized that willingness to support local wineries positively affects the interest in online wine tourism, and the hypothesis was supported by their results at p < .05. Multiple studies noted in Table 1 reported on some indication of the wine tourist’s place of residence relative to the location of the winery visit, such as in-state versus out-of-state or domestic versus international. However, the studies do not attempt to measure whether the tourism of the closest respondents reflects support of the local industry or convenience. Indeed, Bruwer and Rueger-Muck (2019) note that the spontaneous character of decision-making regarding winery visits indicated in their data can be seen as indicative of the hedonic nature of wine tourism, and living near a wine region increases the opportunities for spontaneous wine tourism.
We noted that some virtual wine tastings raised money for a charitable cause, an aspect that has not been explored in prior research on the hedonic nature of wine tourism. In light of research (e.g., Baumann et al., 1981; Cialdini & Kenrick, 1976; Sneddon et al., 2020) indicating that some altruistic behavior has hedonistic motivations, supporting charity may not be antithetical to the view that wine tasting is a hedonic experience. Accordingly, we explored the extent to which a charitable giving aspect to a virtual wine tasting (Charity) is important to consumers.
Finally, given the vast array of options suddenly available for convenient wine tastings, we explored whether an important decision factor in choosing a virtual wine tasting was a recommendation from a friend of family member (Recommended). This is not a feature that a winery may choose to offer as part of a virtual wine tasting, and we did not find an analogous item in the literature on wine tourism as a hedonic experience. However, given the relatively unconstrained options available for participating in virtual wine tastings, we wanted to test whether it was an important decision criterion.
METHODOLOGY AND ANALYSIS
Data Collection
We conducted an online survey of consumers in the U.S. who are at least 21 years old (legal drinking age in the U.S.) and who participated in at least one virtual wine tasting. The participants did not necessarily participate in a virtual wine tasting hosted by a winery; it could have been sponsored by a retail store, not-for-profit organization, or some other entity. A professional panel recruitment agency recruited respondents across the U.S. using its internal recruiting platform. The survey took place over about two weeks at the end of August and early September 2021—coincidentally, near the peak in the U.S. of the Delta variant of the COVID-19 virus. We received 320 completed questionnaires, net of those eliminated by the recruitment agency for failing a speed check (completing the survey in less than half the median time from a soft launch of the survey). We eliminated 59 respondents who failed a quality control check, resulting in 261 usable responses. See Table 2 for descriptive information.
Best – Worst Methodology
The Best – Worst method is a discrete choice model that was first published by Finn and Louviere (1992) and has increased in popularity due to its greater discriminating power than other scale measures (Sirieix et al., 2011). A scale-free extension of the paired comparison approach, Best – Worst presents participants with three or more objects in subsets of the full set of objects and asks them to choose the object in the subset that is best and the object that is worst to infer a ratio-level importance scale (Mueller et al., 2010). Given the scale-free nature of the approach, the results are unaffected by inequivalent scales across respondents (Sirieix et al., 2011).
We used JMP software (v15.1, JMP 2021) to create a balanced incomplete block design that allocated the twelve virtual wine tasting features into twelve four-feature choice sets. Each of the twelve features appeared four times across all choice sets, and each feature was paired with ten of the other features once and the remaining other feature twice. We asked respondents to “pick the feature in the set that is most important to you in deciding to participate in a virtual tasting and the feature that is least important in making that decision.” We treat Most Important as Best and Least Important as Worst.
Best – Worst Analysis
Following Sirieix, et al. (2011), we standardized the Best – Worst raw scores. To standardize the raw scores, we calculated the square root of Best divided by Worst, set the highest square root score to 100, and standardized all other square root scores on the same scale. The standardization results in a probabilistic ratio scale in which all attributes can be compared on their relative size (Sirieix et al., 2011) shown in Table 3.
Across the entire respondent set, the most important factor in determining whether to participate in a virtual wine tasting is that the experience includes a food pairing component, such as small bites or recipes sent with the wine. Food Pairing was chosen Most Important more times (422) and Least Important fewer times (153) than any other feature to give it the highest Best minus Worst (B-W) value (269).
Next in importance is the Online Quality, followed by the availability of tasting-size bottles for the wines featured in the wine tasting. These two features had the same B-W value (165). Tasting-size Bottles was chosen Most Important more often that Online Quality (393 v. 327) but was also chosen Least Important more times (228 v. 162). The higher variability resulted in a lower standardized value. The educational and entertainment aspects of a virtual wine tasting were also statistically significant positive (important) factors in deciding to participate in a virtual tasting.
The least important feature was having the virtual wine tasting session recorded for viewing at the participant’s convenience or for repeat viewing later. Recorded was chosen Least Important more times (430) and Most Important fewer times (74) than any other feature. As a result, it had the greatest absolute B-W value (-356) and lowest standard deviation of any feature. It seems that one of the reasons people participated in virtual wine tastings during the pandemic was to connect with other people and have some sense of community, and recorded sessions would not deliver that experience. The hedonic motivation of “socialize with others” seemed to be a strong factor in our study. Almost 36 percent of respondents reported watching their most recent virtual tasting with friends/family with everyone in the same place. Another 20 percent reported watching their most recent virtual tasting with friends/family with at least one person in a different location. The former group could have also used virtual wine tasting as a form of entertainment, another hedonic motivation, when getting together with people in their social bubbles during the pandemic.
Also of low importance was Format, whether the virtual wine tasting was a public or private event and whether it included a small or large number of participants. Format had the second greatest absolute B-W value (-299) and second lowest standard deviation. If participants want to connect with other people and have some sense of community, a private tasting defeats the purpose. The specific person presenting the tasting was also among the features that were affirmatively unimportant to respondents.
A high standard deviation for a feature, especially when the feature’s absolute B-W score is low, reflects a high degree of heterogeneity among the respondents. For example, Discount has a B-W value of 29 and standard deviation of 2.319, Charity has a B-W value of -22 and standard deviation of 2.147, and Local has a B-W value of -42 and standard deviation of 2.097. These features are very important to a group of respondents (B ≥ 240) and among the least important to another group (W > 260). To identify and analyze different segments of similar consumers within the respondent set, we employed cluster analysis.
Clustering Methodology
In this study, there is no specific outcome we wish to predict; we are not, for example, seeking to correlate survey results with the likelihood of participating in another tasting or joining a wine club. Instead, we perform an unsupervised modeling procedure that seeks to identify emergent structure in the data. Unsupervised models do not, in general, come with any notion of statistical significance or predictive metrics. They are not tests of specific hypotheses, but rather, algorithms for quantifying patterns of relationships in data.
Herein we take a clustering approach, with the goal of identifying groups of survey subjects with similar opinions, as measured by the numeric results of the Best – Worst survey questions. Clustering analysis is a class of unsupervised methods in which groups, or “clusters,” are chosen such that the “within-group” differences are smaller than the “between-group” differences. In the context of our study, we apply clustering algorithms to find groups of subjects that agree with each other on important features of a virtual wine tasting more than they agree with subjects in other clusters. The cluster analyses were performed in R Statistical Software (v4.1.3; R Core Team, 2021) using the tidyverse package (Wickham et al., 2019) as well as ggdendro (de Vries & Ripley, 2022), dendextend (Galili, 2015), and ggridges (Wilke, 2021) for visualization.
Of the many algorithms for unsupervised clustering, we chose to use the classic agglomerative method. The agglomerative method is a bottom-up algorithm that treats each respondent as a singleton cluster at the outset and then successively merges (or agglomerates) the pair of clusters that is most similar until all clusters have been merged into a single cluster that contains all respondents. The result is a tree-based representation of the objects called a dendrogram. We chose the classic agglomerative method due to the interpretability of the resulting dendrogram, which allows us to explore subgroups within major top-level clusters.
Distance metric
To determine similarity between respondents, we first define a numeric representation of each individual’s responses by assigning the values 1 and -1 to the Best and Worst choice in each question set and assigning zero to the features not chosen. For example, suppose a subject (“Subject A”) is presented with a feature set of {Charity, Education, Presenter, Format}. If Subject A chooses Charity as the most important feature and Presenter as the least, we can represent their response to this question as the vector {1, 0, -1, 0}. Taking this approach to each question set, we arrive at one numeric vector of length 48 (12 question sets of 4 features each) to represent each subject’s survey responses.
We then use a standard distance metric of the absolute or Manhattan difference to determine the distance or dissimilarity between any two subjects’ responses. Suppose another subject (“Subject B”), when presented with the same set as Subject A above, also chooses Charity as most important, but chooses Education as least. This subject would then be represented by {1, -1, 0, 0}.
The Manhattan difference between Subjects A and B is then given by:
(A,B)=|1−1|+|0−(−1)|+|−1−0|+|0−0|=2
In other words, the subjects agreed on two rankings (Charity as Best and Format as Neutral) and disagreed by one step[2] on two rankings (Education or Presenter as Worst/Neutral). We thus achieve a measurement from 0 to 48 between any pair of subjects, with smaller numbers implying stronger agreement on the survey questions. It is worth noting that no two subjects in this study completely agreed on every best-worst rating; the nearest two subjects had a Manhattan difference of 4. It is also worth noting that the Manhattan difference point at which all respondents are merged into a single cluster is 48, complete disagreement.
Cluster identification
One of the features of hierarchical clustering is that it does not determine the optimal number of clusters or indicate where to cut the dendrogram to form clusters. One may cut the hierarchical tree at any given height to partition the data into clusters. When we applied hierarchical agglomerative clustering to this data, we found that the topmost branch point split into five distinct clusters. Mathematically, these clusters all have a maximum Manhattan distance of 48 from each other; i.e., complete disagreement on all topic rankings. In other words, choosing this first split as our primary clustering assignment guarantees that all members of a given cluster agree on at least one topic rank.
Unlike some other cluster analysis methodologies, hierarchical agglomerative clustering retains higher-level structure when a larger number of clusters is chosen. In other words, considering a larger number of clusters results in subdividing one or more of the previous clusters rather than clustering together different respondents than before. Accordingly, we first study the five primary clusters, then consider whether additional insight may be gained by examining the major subclusters that result from a lower tree cut.
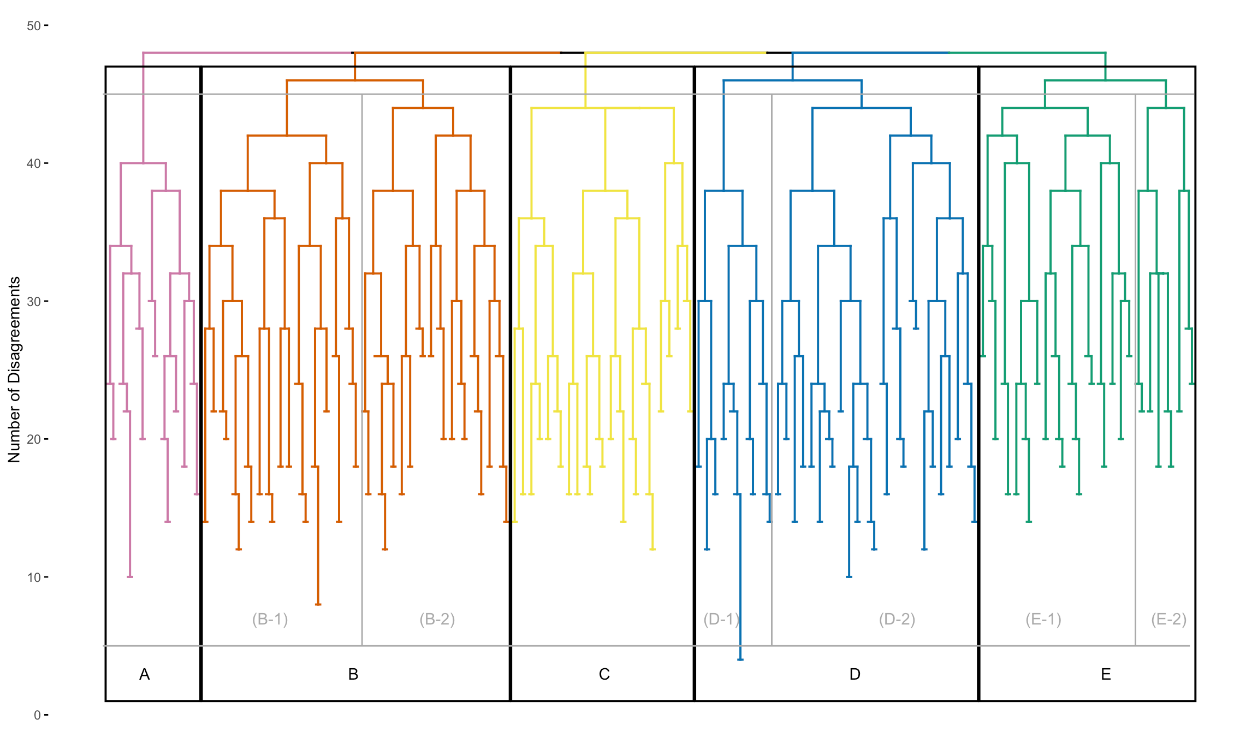
Figure 1 shows the dendrogram resulting from the hierarchical clustering based on Manhattan difference distances of the Best-Worst vectors, colored by the five primary clusters chosen. The width of each cluster in the dendrogram provides a qualitative indication of the size of the cluster. The figure shows, as noted earlier, that no subjects in this study completely agreed on every single Best-Worst rating and that the lowest height (in Cluster D) is 4. The five clusters were fully connected, in that each subject within a given cluster must have agreed with each other subject in the cluster on at least one survey question; and at least one subject in each cluster fully disagreed with at least one subject in every other cluster.

Cluster demographics
We first examine the clusters to determine if there is any association between cluster group and the demographic variables we collected in our survey (age, region, or gender) or propensity to join a wine club from participating in a virtual wine tasting experience.
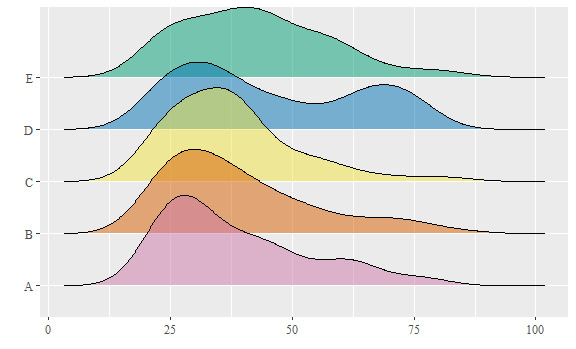
We find weak evidence of a difference in average age across clusters, with Cluster D exhibiting a slightly older member group (ANOVA F-stat = 2.23; p-value = 0.06). As shown in Figure 2, Cluster D has a different distribution than the others, with a notable portion of the members falling in the 60-80 age range. Cluster E appears to have a bit more of an overall spread, meaning more diversity in ages of members, and the oldest modal age; and Cluster A has perhaps a slightly lower age at the curve’s peak, indicating more representation of the younger demographic. However, the average ages by cluster are not significantly different from each other except, weakly, for Cluster D.
We do not find a significant association between cluster and region (Chi-Square = 10.6; p-value = 0.567) or gender (Chi-Square = 3.76; p-value = 0.878). Similarly, we do not find a significant association between cluster and joining the wine club from participating in a virtual wine tasting experience (Chi-Square = 5.59; p-value = 0.232).
Subclusters
As noted in the Clustering Analysis section, because hierarchical dendrograms are nested, cutting the tree at a lower level produces cluster assignments that are strict subclusters of the original five branches, since the order of merges in the dendrogram is not dependent on a choice of cluster number. The next lowest level for cutting the dendrogram in Figure 1 into more clusters would divide the three largest clusters (B, D, and E) into two clusters each, as indicated by the light gray lines in Figure 1. The three largest clusters (B, E, and D respectively) also have the highest measures of intra-cluster disagreement (D, B, and E respectively). Note that Clusters B, D, and E all divide into two subclusters each at the same point on the dendrogram; none of those larger clusters can be subdivided without also subdividing the other two. Clusters A and C remain intact when cutting the dendrogram at that point.
Cluster feature scores
With the five clusters established, and three pairs of potential subclusters identified, we now characterize the clusters by their consumer behavior. In determining the clusters, we represented individuals by the vector of their responses to every Best/Worst question set. However, the goal of the study is to establish the relative importance of each of the features. Accordingly, we now calculate the average score for each feature within each cluster. We then use that data to infer the market segment represented by each cluster.
The average feature scores can range from 1 (all individuals in the cluster ranked this feature as Best in every question set in which this feature appeared) to -1 (all individuals in the cluster ranked this feature as Worst in every question set in which this feature appeared). For example, Cluster A had an average score of 0.78 for the feature Charity. This means that individuals in Cluster A collectively chose Charity as the most important feature at least 78 percent of the time it appeared in a set.[3] Table 4 shows the average feature scores for each cluster (and subcluster).
Looking at the average score for each feature within a particular cluster, we consider three questions:
-
Is the average score positive or negative?
-
Is the average score far from zero?
-
Is there significant evidence that the average score is not zero?
A positive average indicates that the members of that cluster tended to favor that feature as important in deciding to participate in a virtual wine tasting; a negative average indicates that the members tended to regard the feature as unimportant. The magnitude of the average score, whether positive or negative, indicates the strength of group opinion. Averages near zero tell us that either (a) the members of the cluster mostly neither rated that feature as important nor unimportant, or (b) the members of that cluster were not in agreement and about as many rated that feature as important as unimportant. Average scores closer to 1 or -1 in general indicate strong agreement of opinions within the cluster.
A high positive average score could indicate that the members of the cluster mostly agreed on that feature’s importance. On the other hand, it could indicate that a small set of members felt very strongly, while the rest were more neutral, resulting in a high variance among the scores given by members of the cluster. To determine whether there was significant evidence that the average score is not zero, we ran tests of statistical significance as described below.
Cluster personas
We next create a visual representation of the “personality” for each cluster using bars that indicate the direction and degree of the cluster’s average score for each feature. Average feature scores are indicated by green bars when positive and brown bars when negative. Bars reaching farther to the right (dark green) are features that were more often chosen as Best by members of the cluster, and bars reaching farther to the left (dark brown) are those more often chosen as Worst.
Gray error bars represent approximate simultaneous 95 percent confidence intervals for the average feature scores for the cluster.[4] In other words, features for which this error bar does not cross the midpoint line at 0 can be regarded as statistically significant at the 0.05 level for that cluster, and an error bar with an end point farther from the midpoint line indicates a higher level of significance. To determine whether the calculated average score indicates a statistically significant average preference among members of the cluster, we perform a t-test for the mean. Features scores found to be significantly far from zero are marked with one, two, or three stars, indicating significance at the 0.1, 0.05, or 0.001 levels.
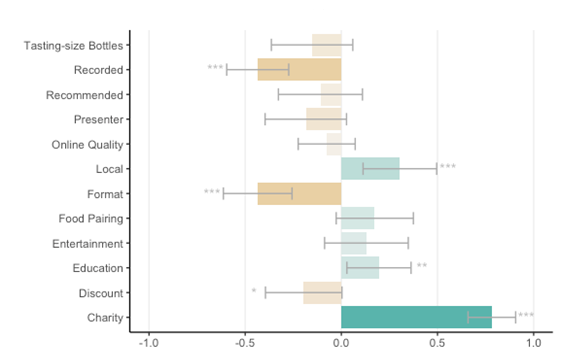
Cluster A: Tasting for a good cause
Cluster A may be the least hedonically motivated group in the sample. Members of Cluster A participate in virtual wine tastings that support a good cause (Figure 3). Cluster A is the smallest of the five clusters and has the highest degree of intra-cluster agreement. With their focus on supporting a good cause, members of Cluster A may be the least drawn to virtual wine tastings by the hedonic motivations found in most wine tourism studies.

The most important feature for Cluster A is that the virtual wine tasting raises money for a charitable cause (0.78). It is the only cluster to give Charity a significant positive score, and that score is the greatest in absolute value of the 60 primary cluster scores in Table 4. Another feature that is significantly positive for Cluster A is that the wines or winery featured in the virtual tasting is local, and it gives Local (0.30) a higher average score than any other cluster. Education (0.20) is a positive feature for Cluster A, but with a weaker level of significance. Members of Cluster A may also be motivated by a sense of connection, as it is the cluster with the second strongest negative score for Recorded (-0.43). They find Format (-0.43) equally unimportant. Cluster A has the highest percentage of members from the Midwest and has the highest percentage who watched the tasting with other people, at least one of whom was in a different location, although there is not a statistically significant difference between groups on these two traits. They are somewhat less likely to join a wine club as the result of participating in a virtual tasting, but this result is also not statistically significant.
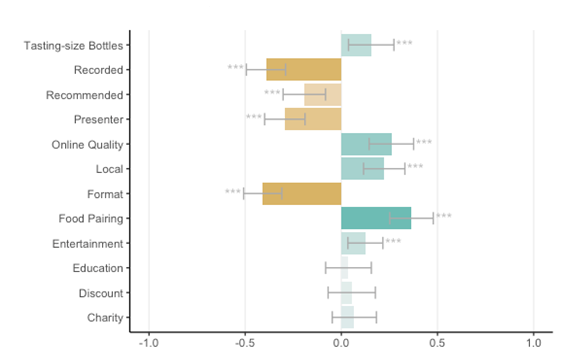
Cluster B: Tasting as a social activity
Cluster B (Figure 4) members join virtual wine tastings as a social event. Food Pairing (0.36) is their most important feature, and they give it the second highest score of all the clusters. They prefer their virtual wine tastings to have a professional look and feel. Online Quality is their second most important feature, and they also give it the second highest score of all the clusters. At the same time, it is important for them to support local wineries. They give Local the second highest score of all the clusters and are one of the two clusters to give that feature a positive average score. The average scores for all three of these features are highly significant. This cluster also places importance on Tasting-size Bottles (0.16) and Entertainment (0.12). Cluster B does not place a high degree of importance on these features, but their positive importance is highly significant. Cluster B is tied for the highest percentage who watched their last virtual tasting with friends/family in one place. Cluster B aligns with in-person wine tourists motivated by the overall hedonic experience rather than the experience of the wine itself.

Format (-0.41), Recorded (-0.39) and Presenter (-0.29) are the three most unimportant features for Cluster B, with all three being highly significant. Less significant but still unimportant is Recommended (-0.19). This is the only cluster with a statistically significant average score in either direction for Presenter and the only cluster with a statistically significant negative score for Recommended. If the virtual wine tasting has the features they want for the focal point of a social event, especially a food focus and a quality production from a local winery, Cluster B members do not care about details such as who is presenting or what the format is. They want to experience tasting in the moment and not watch a recording, and they do not need to seek the advice of family or friends to decide on a tasting host.
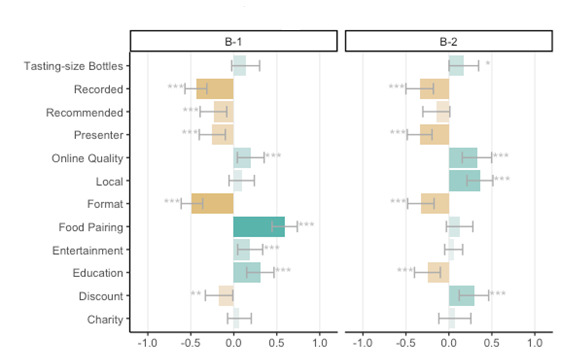
Cluster B has more members than any other cluster, and it has the second highest measure of distance or disagreement within the cluster. The next lowest split of the dendrogram divides the cluster into two subclusters of nearly equal size (Figure 5). B-1 places the highest level of importance on Food Pairing (0.59) and then Education (0.31). The average score for Food Pairing is tied for the 4th highest absolute value of the 96 cluster/subcluster scores in Table 4. For this subcluster, the wine tasting is an important element of the social gathering, and they may also be looking for food and wine ideas for a future social event. B-2 places the highest level of importance on Local (0.36) and values Online Quality (0.33) and Discount (0.29) as well. In contrast to B-1, they place a highly significant and meaningful negative value on Education (-0.25). For B-2, the virtual wine tasting seems more to be the backdrop of the social event rather than the centerpiece.
We emphasize that in this context, distance or disagreement is limited to a few nuanced divergences of opinion within the larger main cluster. Mathematically, the two subgroups show much higher agreement with each other than with any clusters outside of B. Indeed, Figure 5 shows that the two subclusters agree directionally (positive or negative) on ten of the twelve features, and five of those ten have the same level of significance. Online Quality remains important, and Recorded, Format, and Presenter remain unimportant to both subclusters at statistically significant levels. Charity remains slightly positive but insignificant for both subclusters. The results do not mean that members of B-2 hate education aspects of a virtual wine tasting or that B-1 hates discounts; they show that those features do nothing to attract the respective subclusters. The subclusters are not significantly different in terms of age, region, gender, or the proportion joining a wine club based on participating in a virtual wine tasting.
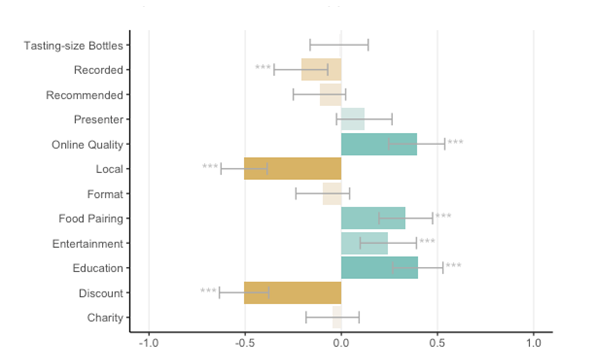
Cluster C: Hobbyists or luxury tasters
While Charters and Ali-Knight (2002) observed that the level of interest in wine may vary greatly among tasting room visitors, members of Cluster C seem to find wine central to their virtual wine tasting experience. Virtual wine tastings seem to be a hobby or special interest for the members of Cluster C (Figure 6), and they want a high-quality overall virtual wine tasting experience. They want a professional virtual wine tasting production, and they want it to be entertaining as well. This cluster has the highest average score for Online Quality (0.39), and it is the only cluster that has significantly positive average scores for the trio of Education (0.40), Entertainment (0.24), and Food Pairing (0.34). They produced the highest positive average score for Presenter (0.12), but the score is not statistically significant. They place a highly significant negative value on Local (-0.51), and this is the only cluster to give a highly significantly negative score to Discount (-0.51). These two scores are in the top three in magnitude for all cluster-feature scores in Table 4.

While every cluster gives a highly significant negative score to Recorded, Cluster C is tied for the least negative score (-0.21). They agree that they are not interested in recorded tastings, as the score is highly significant; however, the magnitude of this opinion is not as strong as their focused non-interest in Local and Discount. That focus could also explain why this is the only cluster for which the negative average score for Format (-0.10) is not statistically significant.
Cluster C is the second smallest of the clusters, although it is almost twice as large as Cluster A. The members of Cluster C agree on the main points, with the second highest degree of agreement within the cluster. Cluster C had the highest proportion of members who joined a wine club after participating in the winery’s virtual wine tasting in our study. They also had the highest proportion reporting having participated in five or more virtual wine tastings.
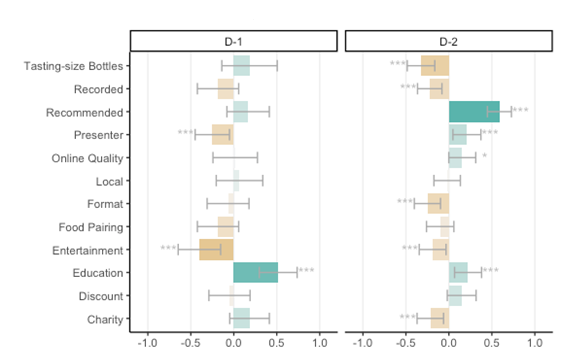
Cluster D: Tasting to learn about wine
Cluster D (Figure 7) is the median cluster in terms of size and has exactly the average number of members (rounded to a whole number). This cluster, more than any other, seems to approach a virtual wine tasting as primarily a learning experience. As discussed in the Cluster Demographics section, above, we find weak evidence that Cluster D has a slightly older average age, with a notable portion of the members falling in the 60-80 age range. It also exhibits the highest degree of intra-cluster disagreement.
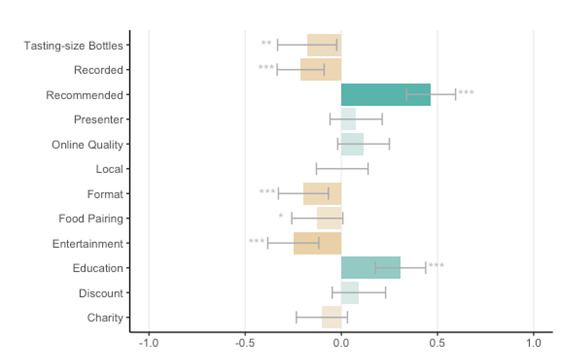
The feature with the greatest absolute value for the average score is Recommended (0.47), and this is the only cluster to give it a positive average score. Cluster D also highly values Education (0.31). On the other hand, Entertainment is least important (-0.25) and has a highly significant score; this is the only cluster to give that feature a negative average score. Cluster D chose Recorded (-0.21) and Format (-0.20) as least important to an almost equal degree as Entertainment. Still, Cluster D is tied with the Cluster C for giving Recorded the least negative score of any cluster.
Cluster D gives Tasting-size Bottles (-0.18) a significant negative average score and are the only cluster to do so. Likewise, this is the only cluster to give Food Pairing (-0.12) a negative average score, although it is only marginally significant.
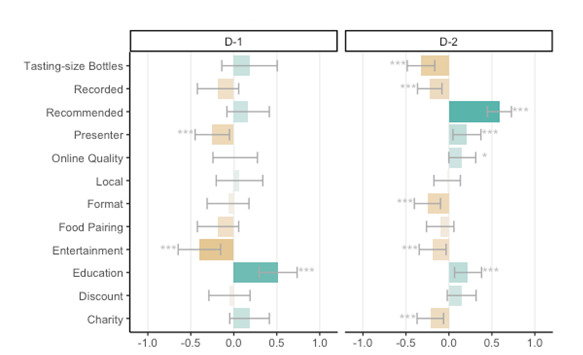
In the subcluster analysis, Subcluster D-1 is a small group, under 30 percent of Cluster D and the smallest of the clusters/subclusters. This subcluster appears to be highly focused on using virtual wine tastings to learn more about wine. It gives Education the greatest absolute average score for this feature (0.52), and that score is in the top 10 percent of all 96 average scores in the subcluster analysis. It is the only feature to receive a significant positive average score from Subcluster D-1, and it is highly significant. The subcluster gives Entertainment (-0.40) its most negative average score, in the top quintile of negative average scores in the subcluster analysis. They have a more favorable view toward Charity (0.18) and Tasting-size Bottles (0.18) than the cluster as a whole and certainly more favorable than their counterparts in Subcluster D-2, but those scores are not statistically significant.
Subcluster D-1 gives the lowest average score to Food Pairing of any group (-0.18), though the score is not statistically significant. On the other hand, they give Recorded the least negative average score of any group, and the score is not statistically significant. It is the only group for which the negative average score for Recorded is not highly significant.
Subcluster D-2 contains over 70 percent of the full cluster and is most influenced by the recommendation of family and friends. The average score for Recommended (0.59) is tied for the fourth greatest absolute average score of any feature in the subcluster analysis, and this is the only group to have a significant positive score for Recommended, and it is highly significant for D-2. They place a highly significant positive value on Education (0.22) but give it less than half the average score given by their counterparts in D-1. Similarly, like D-1 but to a lesser extent, D-2 gives Entertainment (-0.19) a highly significant negative average score. They also assign highly significant negative average scores to Format (-0.25) and Recorded (-0.22), which are negative but insignificant for D-1.
In the biggest contrast with D-1, D-2 gives Presenter (0.21) a highly significant positive average score. As with Recommended, this is the only group, cluster or subcluster, to have a significant positive score for Presenter. Tasting-size Bottles (-0.32) and Charity (-0.22) receive highly significant negative average scores from Subcluster D-2.
While Cluster D as a whole values the educational experience of a virtual wine tasting, Subcluster D-2 seems to rely much more heavily on the direction of others to obtain the education—friends and family to recommend good wines or a good winery to taste and the presenter to provide pertinent facts and guide them through the tasting.
Interestingly, the bimodal age distribution for Cluster D was not split by the subcluster analysis; the subclusters do not have a significant difference in mean age between them. We found some evidence (Fisher’s Exact Test, p = 0.054) of a difference in the gender distribution between these subclusters. D-1 is about 60 percent male and 40 percent female, while D-2 is about 73 percent female and 27 percent male.
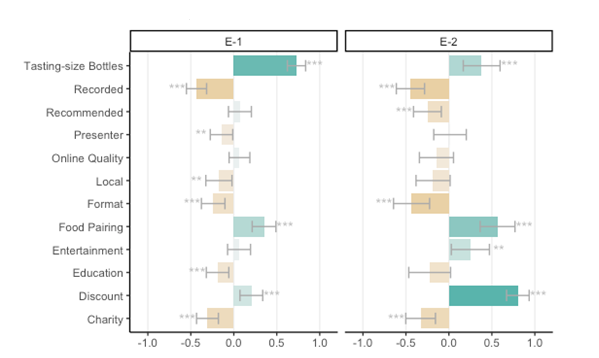
Cluster E: Tasting for an easy, fun time
Members of Cluster E, the second largest cluster, seem to participate in virtual wine tastings for a good time and perhaps for a sense of escape during the pandemic restrictions while keeping an eye on the budget (Figure 9) and in doing so may exhibit the most stereotypical example of hedonic motivation. They seem to see virtual wine tastings as an opportunity to have cheap fun. The greatest absolute average value for this cluster is for Tasting-size Bottles (0.63), the second greatest absolute value of the 60 primary cluster scores in Table 4. Their next highest positive score is for Food Pairing (0.41). Both represent the greatest absolute average score for that feature of any of the clusters. Cluster E gives a highly significant positive score to Discount (0.37), the only primary cluster to award it a significant positive score.
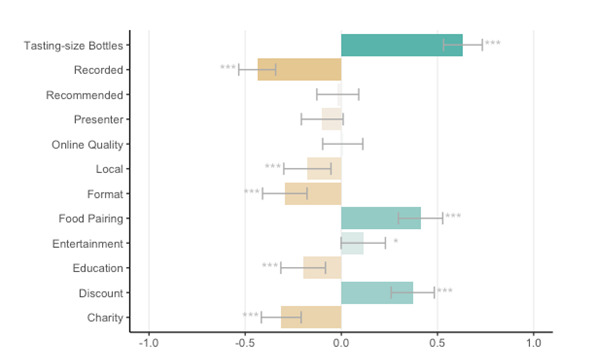
For a group that seems to like a good time, they are not highly enthusiastic about Entertainment (0.11). This average score is moderately significant but is the lowest of the significant positive scores for this cluster. This cluster seems to be less focused on the structure and presentation of the virtual event, and more on the act of tasting.
While every cluster gives a significant negative score to Recorded, Cluster E is the most negative (-0.44). This cluster gives a significant negative score to Charity (-0.31) and to Education (-0.20), the only cluster to do so for either feature. Format (-0.29) and Local (-0.18) are also significantly unimportant to members of the cluster in deciding to participate in a virtual tasting.

While all members of Cluster E seem to want to participate in virtual wine tastings that are fun, without having to take any of it—including the cost—too seriously, the subcluster analysis (Figure 10) distinguishes between E-1 and E-2 primarily based on the most preferred method of making it a budget-conscious experience. The E-1 subcluster prefers Tasting-size Bottles (0.73) to Discount (0.2), while the E-2 subcluster prefers Discount (0.80) to Tasting-size Bottles (0.38). Still, both features are highly significant for both subclusters. The average score for Discount for E-2 is the greatest absolute value for a feature in the subcluster scores in Table 4; the average score for Tasting-size Bottles for E-1 is the third greatest.
There is no feature on which the subclusters significantly disagree on direction. Recommended is negative (-0.25) and highly significant for E-2 and is positive (0.07) but insignificant for E-1. Presenter is negative (-0.14) and significant for E-1 but is barely positive (0.01) and insignificant for E-2. Online Quality is also negative (-0.14) for E-1 and positive (0.07) for E-2; however, the feature’s score is not statistically significant for either subcluster.
Otherwise, the differences are a matter of degree. Food Pairing is positive and highly significant for both subclusters but more important for E-2 (0.57 v. 0.35). Format is negative and highly significant for both subclusters and is also more important, in a negative sense, for E-2 (-0.43 v. -0.24). Recorded and Charity are negative and highly significant with nearly identical average scores for E-1 (-0.43 and -0.31, respectively) and E-2 (-0.45 and -0.33, respectively). Entertainment is positive for both subclusters (0.06 and 0.25) but significant only for E-2. Education and Local are negative for both subclusters. The average scores are slightly lower for E-1 (-0.19, -0.17) than for E-2 (-0.22, -0.18), yet Education is highly significant and Local is significant for E-1 but insignificant for E-2.
E-2 is the second smallest subcluster and has the highest level of intra-cluster agreement among the eight cluster/subcluster groups. There is weak evidence of a regional difference between the subclusters of Cluster E (Fisher’s Exact Test, p = 0.10), with E-1 having a much higher proportion from the Midwest and higher proportion from the West and E-2 having a higher proportion from the South. We also found weak evidence (Fisher’s Exact Test, p = 0.1075) of a difference in the proportion of the subcluster joining a wine club after experiencing a virtual wine tasting, with members of E-1 joining at almost twice the rate of members of E-2—an ironic result since one of the primary benefits of many wine clubs is discounts on purchases.
CONCLUSION
Managerial Implications
Even with the COVID-19 pandemic essentially in the past, virtual wine tastings offer opportunities to reach and engage with customers who cannot easily visit the winery’s tasting room. Likewise, stores may find that virtual wine tastings offer a means to promote their products to customers in ways they cannot in person, and other organizations may be able to use them to reach beyond their normal geographical sphere.
The results of this study support a long line of literature finding that the motivations to participate in wine tourism are largely hedonic in nature, even when experienced in the form of a virtual wine tasting. Accordingly, managers designing and running virtual wine tastings need to focus foremost on assuring that the virtual tasting is a pleasant experience for the participants and that potential pain points are avoided as much as possible. In addition, our findings support the prior literature indicating that a variety of factors may motivate the participation of guests, and the wine itself is often not one of the leading motivations.
Food Pairing was the most important feature overall. It had a positive average feature score in four of the five clusters. The quality of the online presentation was the second most important feature overall and also had a positive average feature score in four of the five clusters. Education and Entertainment were both important overall and had positive average feature scores in four of the five clusters; however, the cluster with the negative average feature score for each felt strongly negative about it. Managers need to balance entertainment and education carefully and be aware of which of the two their target market is likely to favor.
The availability of tasting size bottles was the third most important feature overall, yet only two of the clusters (albeit the two largest clusters) gave it an positive average feature score. On the other hand, the negative average feature score was significant in only one of the three other clusters. This finding would indicate that virtual wine tasting hosts that offer tasting size bottles should offer it as an option instead of the required format for participating in the tasting.
The least important feature was Recorded, indicating that virtual wine tasting participants tended to prefer the live event and did not have a desire to relive the experience. Format was next least important, so in general participants did not seem to care if there was a large group or small group of people joining them in the experience. None of the clusters gave either of these features a positive average feature score.
The third least important feature overall was Presenter. Only one cluster gave it a positive average feature score, and that score was not significant. In general, it is more important for a manager creating a virtual wine tasting to focus on finding a presenter who comes across well and connects with participants in the online format rather than worrying about the position of the presenter in the winery. Even for participants who want to learn more about the wines, the winemaker may not be the best, or most entertaining, person to present that information.
Our study provides a framework for winery managers and others hosting virtual wine tastings to segment the market and understand what motivates their target market to choose to participate in a virtual wine tasting. Understanding their target market better, and being mindful of the hedonic nature of the motivations for participating, managers may create virtual wine tasting experiences that have greater appeal to their target market and market to them more successfully.
Contribution to Theory
This paper is the first study, to our knowledge, to extend the understanding of wine tourism as a hedonic experience applying the experiential view to an online setting. Our findings suggest that virtual wine tourism experiences, here in the form of virtual wine tastings, maintain the hedonic nature of in-person wine tourism. Features with a stronger connection to hedonic motivations, such as Food Pairing, Entertainment, Education, and Online Quality, tended to be scored as more important than features with a more tenuous connection to hedonic motivations, such as Format, Presenter, and Recorded.
Not all the hedonic motivations to participate in wine tourism recognized in prior research are applicable in an online setting, some motivations may apply but need to be interpreted differently, and new motivating factors may be identified. Likewise, the micro-winescape is important in creating a memorable and pleasurable online experience just as it is in person, but the important elements of the winescape will be different and need to be determined. This paper takes the first steps down that path.
Limitations and Future Research
This paper, like any research project, has inherent limitations that create opportunities for future research. Our data was collected near the peak of the wave of COVID cases from the Delta variant in the U.S. The hoped-for opening of society to normal events that had seemed to be happening a month or two before seemed to be vanishing around the time of our survey. It is not clear how people’s feelings about and preferences related to virtual wine tastings may have changed since then.
Our need to constrain the length of the survey led us to present general categories of features. When presented with a specific example of the feature, such as celebrity, winery owner, or winemaker for Presenter or games, music, or trivia for Entertainment, participants may have responded differently. Future research may explore these issues in more depth and investigate what practices contribute to a customer’s perception of quality in the interaction.
Moreover, we did not explore any role macro-level or regional winescape attributes, more purely servicescape features, or the quality of the interaction between the customer and the wine business may have on the customer’s decision to participate in a virtual wine tasting or perception of the experience. These frameworks for analyzing in-person wine tastings do not map perfectly to virtual wine tastings, and further research is needed to determine which elements have an online analogy and which are simply not applicable in this different environment.
Similarly, our need to limit the sample size impacted our data analysis. Larger studies or multiple studies may indicate that some of the insignificant results were meaningful but had a small effect size, which resulted in insignificance with the limited sample size. Finally, our sample was limited to people in the U.S. Whether virtual wine tourists in other countries are driven by different motivations and prefer different features is an open question for future research to explore.